|
Calculation Options
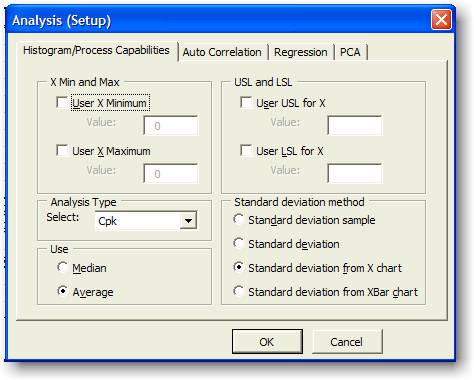
There are three important parameters to
select to display the process capability
|
Option |
Description |
Recommended |
|
A |
Calculation type |
Cpk for all
Ppk for auto Industry
Six Sigma for Six Sigma |
|
B |
Use Average or Median |
Use Average unless specified by
customer |
|
C |
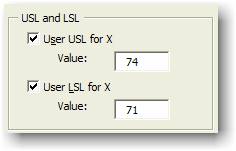
Standard Deviation Calculation
Method |
Use STD Sample |
Options A – Calculation Type
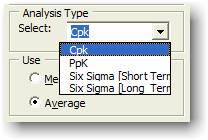
There are four options used in this
calculation
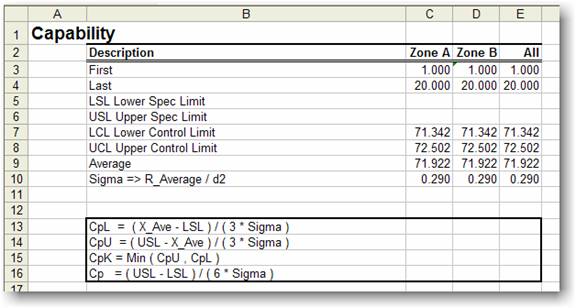
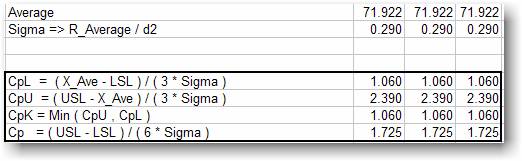
[1] Cpk: Cp and
Cpk, commonly referred to as process capability indices, are
used to define the ability of a process to produce a product
that meets requirements. In the Cpk calculation, the
standard deviation is based on subgroups of the data using
subgroups ranges, standard deviations or moving ranges. Normally
is calculated using Sigma (R_Ave/d2)
[2] PpK
In the Pp and Ppk calculations, the
standard deviation used in the denominator is based on all of
the data evaluated as one sample, without regard to any
sub-grouping. The calculation is based on Standard Deviation of
Data
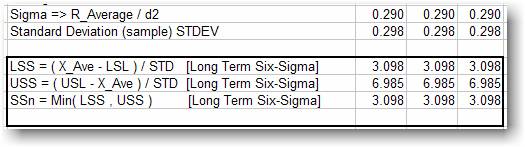
[3] Six Sigma [short Term]
[4] Six Sigma [Long Term]
Options B – Average or Median
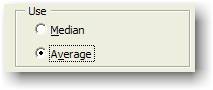
Median: The median is the number in
the middle of a set of numbers; that is, half the numbers have
values that are greater than the median, and half have values
that are less.
Average: average (arithmetic mean)
of a set of numbers. (Recommended)
Option C – Standard Deviation Method
There are four methods available to
calculate the Sigma or standard deviation of the data.
Normally option 3 is used.
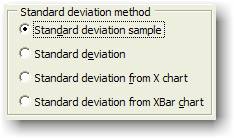
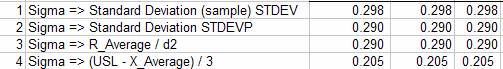
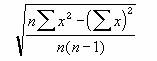
(1) Standard Deviation Sample
The Sigma is calculated based on standard
deviation based on a sample. The standard deviation is a measure
of how widely values are dispersed from the average value (the
mean).

Remarks
- MS Excel STDEVA is used
- STDEVA assumes that its arguments are a
sample of the population. If your data represents the entire
population, you must compute the standard deviation using
STDEVPA.
- Arguments that contain TRUE evaluate as
1; arguments that contain text or FALSE evaluate as 0 (zero).
If the calculation must not include text or logical values,
use the STDEV worksheet function instead.
- The standard deviation is calculated
using the "nonbiased" or "n-1" method.
- STDEVA uses the following formula:
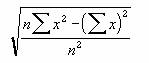
(2) Standard Deviation
The Sigma is calculated based on the
standard deviation of the entire population given as arguments,
including text and logical values. The standard deviation is a
measure of how widely values are dispersed from the average
value (the mean).

Remarks
- Use MS Excel STDEVPA Function.
- STDEVPA assumes that its arguments are
the entire population. If your data represents a sample of the
population, you must compute the standard deviation using
STDEVA.
- Arguments that contain TRUE evaluate as
1; arguments that contain text or FALSE evaluate as 0 (zero).
If the calculation must not include text or logical values,
use the STDEVP worksheet function instead.
- For large sample sizes, STDEVA and
STDEVPA return approximately equal values.
- The standard deviation is calculated
using the "biased" or "n" method.
- STDEVPA uses the following formula:
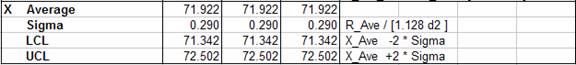
(3) Standard Deviation form X-Chart
The Sigma is calculated from Average
of Range divided by d2 constant.

(4) Standard Deviation from X-Bar
Chart
The Sigma is calculated from Average
of Range divided by d2 constant.
 |