SQC
for Excel ™ is a Microsoft® Excel add-in program for
developing statistical Quality Control (SQC) and Statistical Process
Control (SPC) calculations, reports and charts automatically.
The SQC for Excel™ program can be used to analyze any valid data
available within the Microsoft Excel® spreadsheet. The data is
copied to a SQC spreadsheet with references back to the original
spreadsheet or as value. By using the link any future changes in the
original data will result in automatic re-calculation of all charts
and limits. To analyze a data set, highlight all the data points to
be processed.
![[SQC for Excel Selected Data]](sfx97_d01.gif)
Then choose SQC from the Excel main menu.
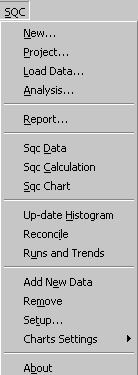
From SQC Menu, choose New option. The SQC chart selection wizard
will provide the user with the appropriate dialog boxes to choose
all necessary parameters. A simple example is shown below.
![[Select SQC for Excel Parameters 1/4]](sfx97_d02.gif)
Enter the user parameters and click on NEXT button.
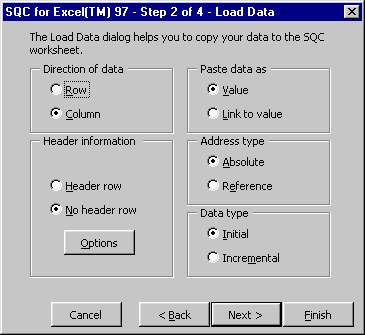
You can define the type of raw data for the SQC for Excel
program. The data is then copied to a new spreadsheet with the
required links.
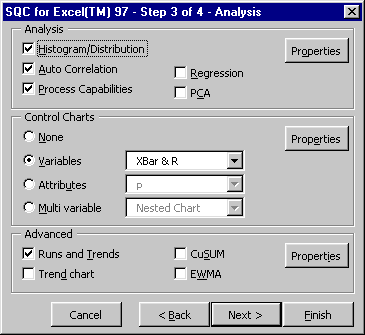
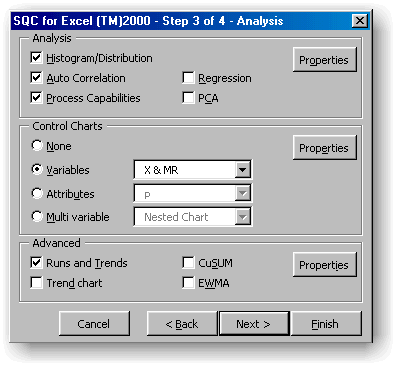
Next you need to specify the analysis type, kind of control
charts and any advanced feathers. Each of the above selection have
their own properties that can be set to the correct value. For
example the control chart properties dialog box is shown below.
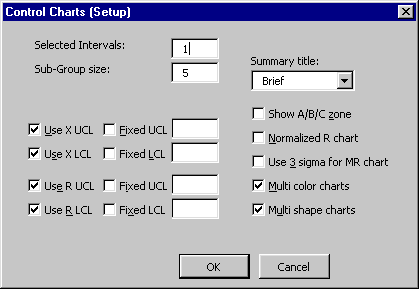
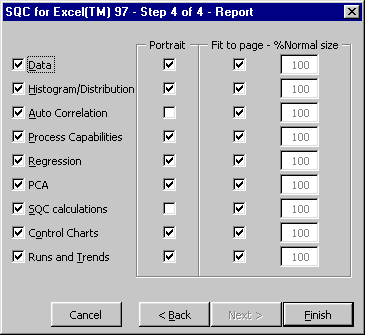
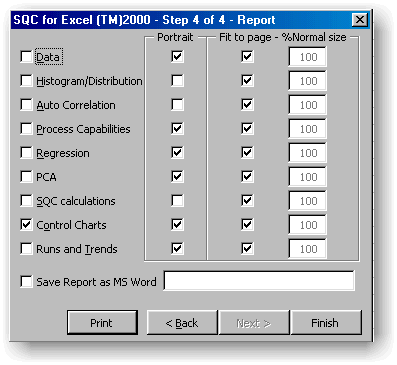
The user can select varieties of reports to be generated
automatically.
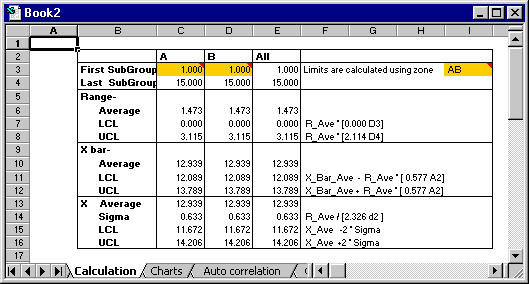
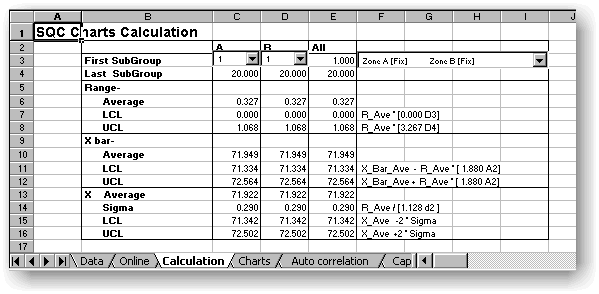
All calculations and equations are explained in detail.
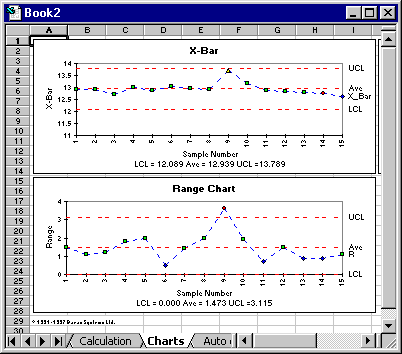
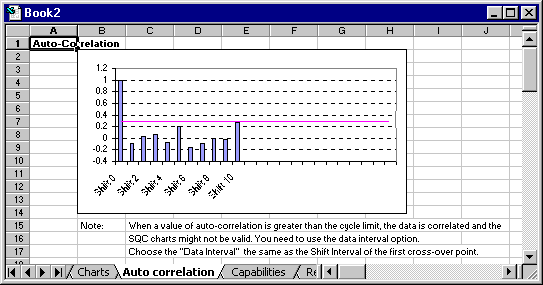
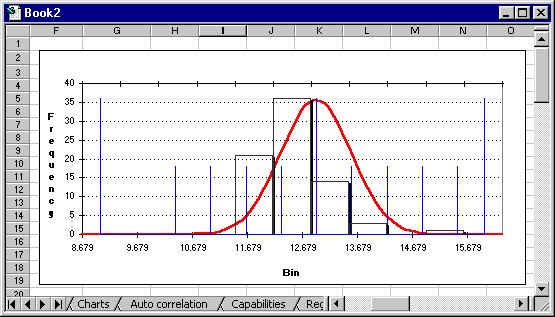
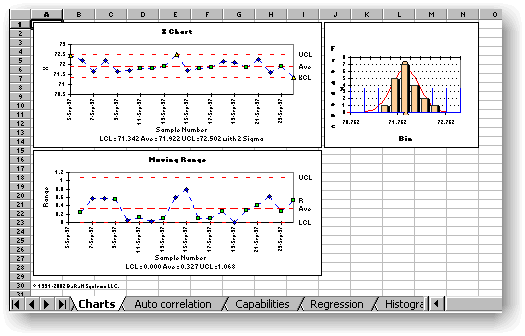
In this example X-Bar, R, Histogram and Auto-correlation charts
are plotted automatically from the data selected in the spreadsheet.
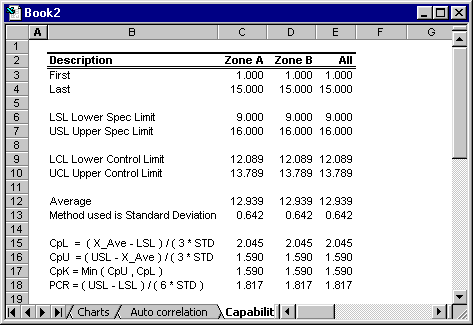
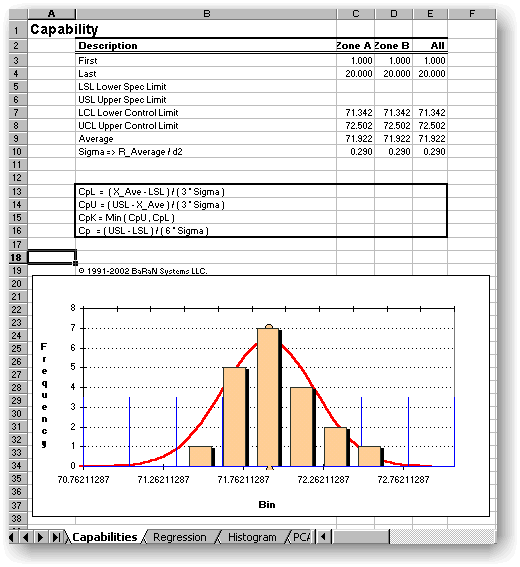
Process capabilities are calculated as:
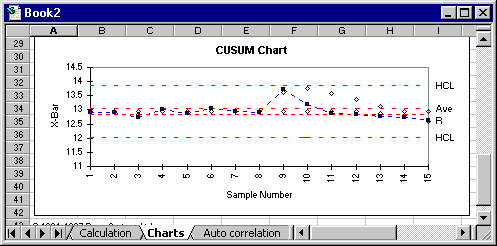
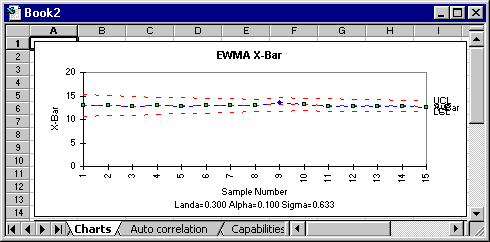
The advanced charts such as EWMA, CUSUM or Trend charts can be
done with just selecting one button.
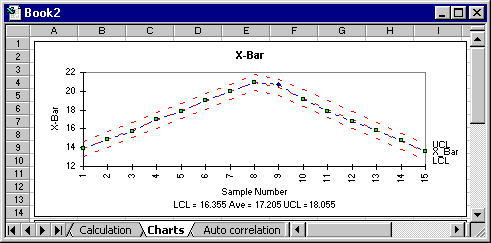
The following example provides you with the details of how to use
the SQC for Excel program.
A- Start the SQC for Excel program.
- Choose the following option from the Excel menu:
- Start
 Programs
 MS Excel
B- Run a Sample Case
- Choose the following option from the Excel menu:
- SQC
 Cases
Cases [2] Case B - X and Moving Range Chart
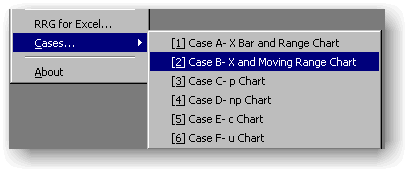
Follow the instructions and pay attention to the selections.
Click OK
C- The program automatically opens the file CASES.XLS
and selects the data with a the first row containing the LABEL and
DIAMETER labels. There are 20 data sub-groups.
Click the Next button.
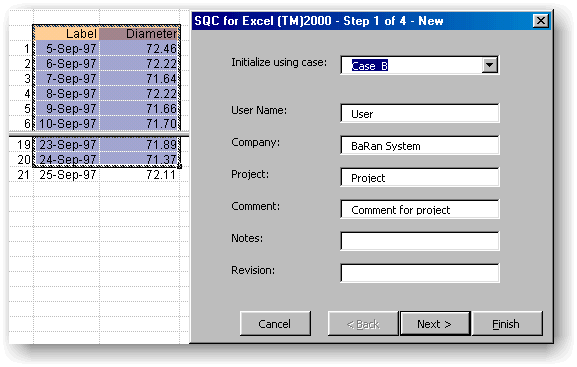
D- The data has a Header row and the appropriate option is
checked in the "Header information" selection box.
Click the Next button.
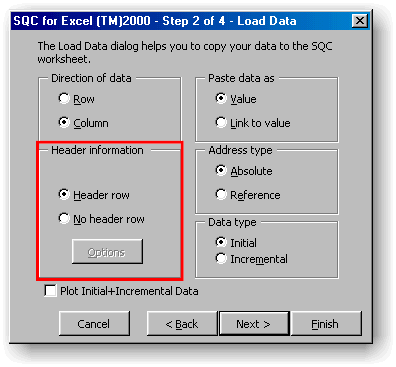
E- The X and MR (Moving Range) chart is selected.
Click the Next button.
F- This dialog box sets the PRINT option.
Click the Finished Button.
G- In the worksheet "Charts" the SQC Charts are
plotted.
The Calculation is shown in the worksheet "Calculation"
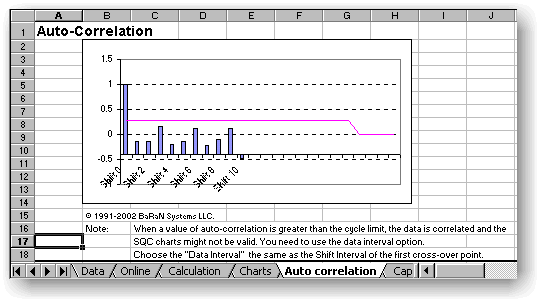
The "Auto Correlation" worksheet display the AUTO-CORRELATIONS of
data.
The data process capabilities are show in the "Capability"
worksheet.
![]()